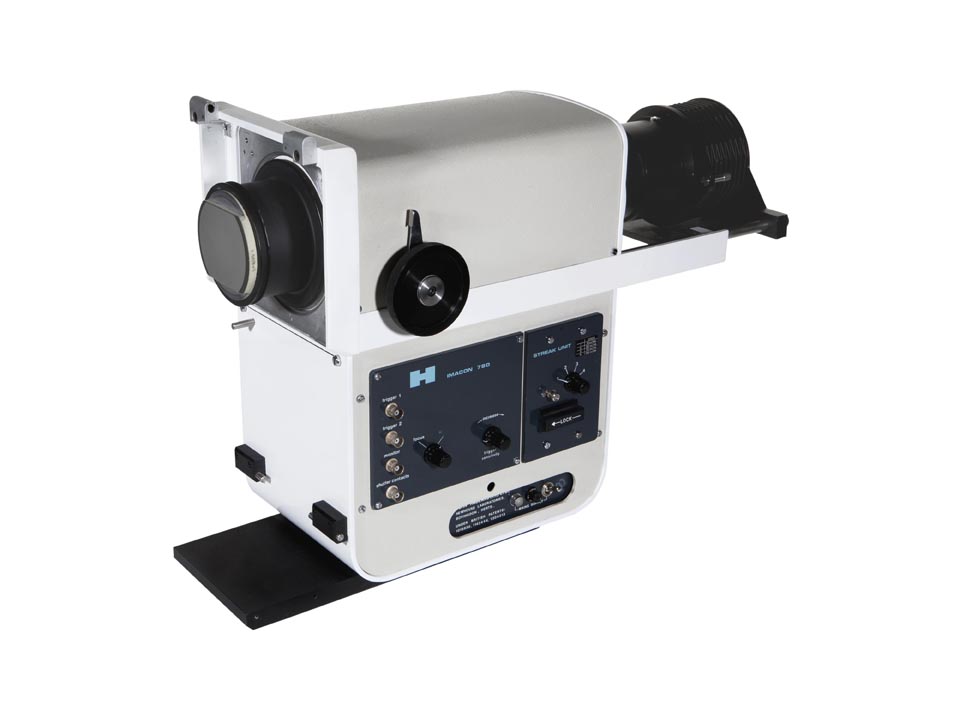
Imacon 790 Streak and Framing Camera

We no longer offer this product. If you want repair service or a custom modern equivalent, contact us.
Includes
- Imacon 790 streak/framing camera
- Streak module with 10, 20, 50, and 100ns/mm speed selection
- Power cable
- User/service manual with schematics
Refurbished by Hofstra Group
- Verified performance
- Replaced degraded components
- Tuned electronics for best performance
- Thoroughly inspected
Options Available from Hofstra Group
- Digital Camera Upgrade
- Standard lead time 8 weeks; expedite available
- Digital camera upgrade
- Framing modules from 10,000 to 20 million fps
- Streak modules from 1 ns/mm to 100 μs/mm
- Standby modules for recording unpredictable events
- Image intensifier
- Input optics
- Delay generator for synchronization
High speed photography has long been used as the prime means of obtaining pictorial information from events that are too fast for visual recording. It is an accepted fact that a sequence of images of a high speed process has offered considerable data which has helped evaluate the mechanics of that process, often complementing other instrumentation. As the engineer's appetite for detailed information becomes more voracious, more and more is expected from the cameras which record the data.
The image converter camera has, for many years, been the recognized standard for recording many types of high and ultra high speed phenomena. This has resulted from the simplicity of operation, portability and the ease of synchronization to the event under investigation.
Applications
- Ballistics
- Combustion Research
- Failure Dynamics
- Elasticity, Crack Propagation and Shock resistance
- Medical Research and testing
- Detonics
- Impact Studies
- Spray and Particle Analysis
- Automotive testing
- Nanotechnology and micro-machines
- Time-resolved optical spectroscopy
- Electrical discharge studies
- Plasma physics
- Laser emission
- Photo-chemical kinetics
- Aerodynamics
Streak Camera Theory
The streak camera converts incident light into electrons and performs a high-speed sweep (deflecting electrons from top to bottom), enabling detection of the time variation of the incident light intensity by converting these into different positions on the screen. (See figure below.)

The light pulse to be measured is focused onto the photocathode of the streak tube through the slit, where the photons are converted into a number of electrons proportional to the intensity of the incident light. These electrons are accelerated and conducted towards the phosphor screen, and a high-speed voltage which is synchronized to the incident light is applied. The electrons are swept at high speed from top to bottom after which they are bombarded against the phosphor screen of the streak tube and converted to an optical image.
The optical image which appears on the phosphor screen is called a streak image, and shows the intensity distribution of the incident light, by which the positions of the electrons can be determined in the perpendicular direction over the passage of time. Using this method, the temporal intensity distribution of the light being measured can be displayed as the spatial intensity distribution on the phosphor screen.
Click Here to Download Drawings
Specifications
Light Gain |
40 times brightness gain per unit area for white light (xenon flash). 50 times brightness gain per unit area at 440nm on S20 photocathode. Total brightness gain from cathode to screen is 4 times greater than these figures due to magnification. |
|---|---|
Spectral Response Range |
300 to 850 nm |
Exposure Times |
200 ns at 1 million fps (20% of framing rate) |
Spatial Resolution [lp/mm] |
7 |
Number of Frames Acquired |
8 to 16 |
Photocathode Area |
9 mm high and 8 mm wide |
Dynamic Range |
400:1 at 104 fps and 50:1 at 2x10⁷ fps |
Maximum Trigger Frequency |
0.3 Hz |
AC Input Power |
100, 120, 220, or 240 Vac at 40 Watts |
Streak Tube Magnification |
2 |
Phosphor Material |
Aluminized P11 (blue). Peak response 460 nm; persistance 80 μs. to 10%. Fiber optic output nominal fiber diameter 5.5 micron; numerical aperture 1. |
Temporal Resolution |
200 picoseconds |
Streak Contrast Ratio |
>107 after triggering for 0.7 s |
Framing Contrast Ratio |
Before triggering and in operate mode, deflection shuttering efficiency (shutter open to shutter closed ratio) is >106. After triggering for 0.7 s shuttering efficiency is >107. This returns to 106 after 0.7 s |
CONTACT
JOIN US
ABOUT US
